Introduction
Shapefiles are one of the most common GIS data formats used for representing geographic features such as countries, roads, rivers, and cities. The ArcGIS Maps SDK for Qt provides a powerful and efficient way to display shapefiles directly in a Qt-based C++ desktop application, allowing you to build rich, interactive GIS tools.
In this tutorial, we’ll learn how to load and visualize shapefiles (.shp) using the ArcGIS Maps SDK for Qt inside a QMainWindow application.
Use Case
This example is ideal for:
- Building custom GIS applications that need offline shapefile visualization.
- Visualizing geographical datasets like boundaries, roads, and towns.
- Creating lightweight, high-performance GIS map viewers using Qt C++.
Key Concepts
- MapGraphicsView — Displays the map inside a QWidget.
- ShapefileFeatureTable — Loads shapefile data as a feature table.
- FeatureLayer — Displays the shapefile features on the map.
- Renderers — Define visual styles (line, fill, or marker).
Working Code
#include "mainwindow.h"
#include "ui_mainwindow.h"
#include <QDir>
#include <QDebug>
#include <QCoreApplication>
#include <Map.h>
#include <MapGraphicsView.h>
#include <ShapefileFeatureTable.h>
#include <FeatureLayer.h>
#include <SimpleRenderer.h>
#include <SimpleLineSymbol.h>
#include <SimpleFillSymbol.h>
#include <SimpleMarkerSymbol.h>
#include <Viewpoint.h>
using namespace Esri::ArcGISRuntime;
void MainWindow::setup2DMap()
{
// Create a base map (optional - you can choose any basemap style)
m_map = new Map(BasemapStyle::OsmStandard, this);
// Create a MapGraphicsView widget
m_mapView = new MapGraphicsView(this);
m_mapView->setMap(m_map);
// Add map view to your main window layout
ui->mapviewHorizontalLayout->addWidget(m_mapView);
// Load shapefiles
QString baseDir = QCoreApplication::applicationDirPath();
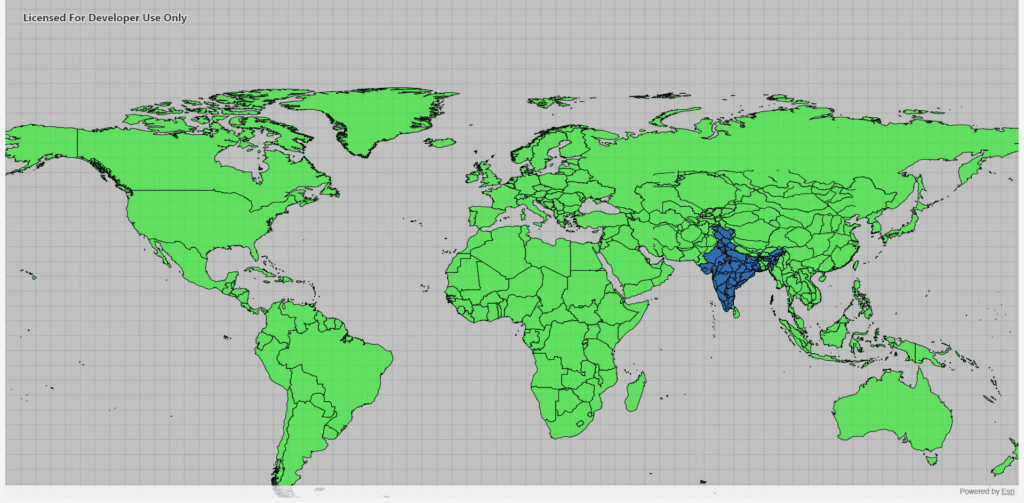
loadShapeFile(QDir(baseDir).filePath("../shapefiles/world.shp"), "world");
loadShapeFile(QDir(baseDir).filePath("../shapefiles/india.shp"), "india");
loadShapeFile(QDir(baseDir).filePath("../shapefiles/roads.shp"), "roads");
}
void MainWindow::loadShapeFile(const QString& path, const QString& key)
{
auto* featureTable = new ShapefileFeatureTable(path, this);
auto* layer = new FeatureLayer(featureTable, this);
m_map->operationalLayers()->append(layer);
// Center map (optional)
Viewpoint center(22.5926, 78.3716, 17500000);
m_mapView->setViewpoint(center);
// Apply renderer based on layer type
if (key == "roads")
{
auto* lineSymbol = new SimpleLineSymbol(SimpleLineSymbolStyle::Solid, QColor("black"), 1.0f, this);
layer->setRenderer(new SimpleRenderer(lineSymbol, this));
}
else if (key == "india")
{
QColor semiTransparentBlue(Qt::blue);
semiTransparentBlue.setAlpha(127);
auto* fillSymbol = new SimpleFillSymbol(SimpleFillSymbolStyle::Solid, semiTransparentBlue,
new SimpleLineSymbol(SimpleLineSymbolStyle::Solid, Qt::black, 1.0f, this), this);
layer->setRenderer(new SimpleRenderer(fillSymbol, this));
}
else if (key == "world")
{
QColor semiTransparentGreen(Qt::green);
semiTransparentGreen.setAlpha(127);
auto* fillSymbol = new SimpleFillSymbol(SimpleFillSymbolStyle::Solid, semiTransparentGreen,
new SimpleLineSymbol(SimpleLineSymbolStyle::Solid, Qt::black, 1.0f, this), this);
layer->setRenderer(new SimpleRenderer(fillSymbol, this));
}
}
Explanation
- Initialize the map with a basemap style using
Map(BasemapStyle::OsmStandard). - Create the MapGraphicsView, which serves as the display widget.
- Load shapefiles via
ShapefileFeatureTableand wrap them inFeatureLayer. - Add the feature layer to the operational layers list of the map.
- Apply renderers for visual styling (e.g., line color for roads, fill color for countries).
Example Folder Structure
project/
├── shapefiles/
│   ├── world.shp
│   ├── india.shp
│   ├── roads.shp
│   └── towns.shp
├── mainwindow.cpp
├── mainwindow.h
└── mainwindow.ui
Conclusion
Using the ArcGIS Maps SDK for Qt, you can easily load and display multiple shapefiles with customized renderers in a Qt C++ application. This approach is lightweight, efficient, and suitable for both offline and online GIS visualization projects.
With just a few lines of code, you can create a fully functional GIS map viewer that supports vector overlays, custom styling, and interactive features.
If you’re interested in a full-fledged GIS solution, check out our flagship product PrithviGIS – a powerful QGIS-based platform for real-time geospatial visualization. PrithviGIS is an indigenous GIS development in India.
Check out our Live Aircraft Simulation using CesiumJS.