Introduction
CesiumJS is a powerful open-source 3D globe and map engine that allows developers to visualize geospatial data in real-time. However, since Cesium doesn’t directly support shapefiles (.shp), we typically convert them to the more web-friendly GeoJSON format.
In this tutorial, we’ll see how to:
- Load a shapefile (in GeoJSON format) into CesiumJS,
- Display it with custom color and transparency,
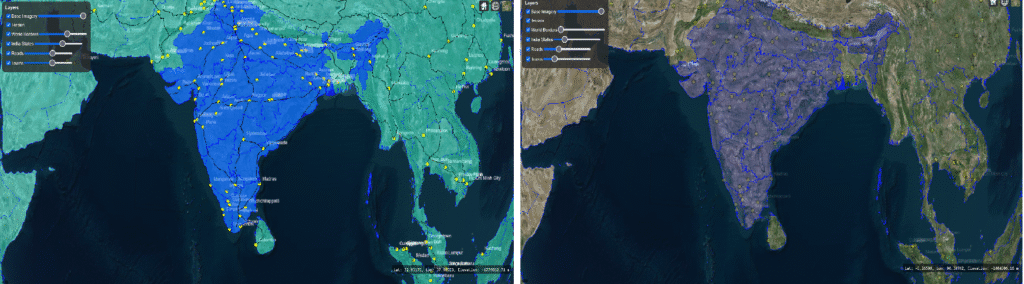
- Add a simple UI to toggle visibility and adjust opacity dynamically.
This is particularly useful when building GIS visualization tools, map dashboards, or defense/mapping applications where multiple layers need to be shown or hidden interactively.
Converting Shapefile to GeoJSON
Before adding it to Cesium, you need to convert your .shp file into .geojson.
You can use QGIS or any online converter like mapshaper.org.
Working Code Example
Below is a simplified version of the CesiumJS code that loads a GeoJSON layer, and adds visibility and opacity controls.
<!DOCTYPE html>
<html lang="en">
<head>
    <meta charset="UTF-8">
    <title>GeoJSON Layer Control in CesiumJS</title>
    <script src="https://cesium.com/downloads/cesiumjs/releases/1.123/Build/Cesium/Cesium.js"></script>
    <link href="https://cesium.com/downloads/cesiumjs/releases/1.123/Build/Cesium/Widgets/widgets.css" rel="stylesheet">
    <style>
        html, body, #cesiumContainer { width:100%; height:100%; margin:0; padding:0; overflow:hidden; }
        #layerControl {
            position:absolute; top:10px; left:10px;
            background:rgba(255,255,255,0.9); padding:10px; border-radius:8px;
            font-family:sans-serif; z-index:100;
        }
    </style>
</head>
<body>
    <div id="cesiumContainer"></div>
    <div id="layerControl">
        <strong>GeoJSON Layer</strong><br>
        <input type="checkbox" id="layerVisible" checked> Show Layer<br>
        <label for="opacityRange">Opacity:</label>
        <input type="range" id="opacityRange" min="0" max="1" step="0.1" value="0.6">
    </div>

    <script>
        // Initialize Cesium viewer
        const viewer = new Cesium.Viewer("cesiumContainer", {
            terrainProvider: new Cesium.EllipsoidTerrainProvider(),
            baseLayerPicker: true,
            animation: false,
            timeline: false
        });

        viewer._cesiumWidget._creditContainer.style.display = "none"; // hide credits

        let geojsonLayer = null;

        // Load GeoJSON data
        Cesium.GeoJsonDataSource.load("data/india_states.geojson").then((dataSource) => {
            geojsonLayer = dataSource;
            viewer.dataSources.add(geojsonLayer);

            // Style polygons
            const entities = geojsonLayer.entities.values;
            for (const entity of entities) {
                if (entity.polygon) {
                    entity.polygon.material = Cesium.Color.BLUE.withAlpha(0.6);
                    entity.polygon.outline = true;
                    entity.polygon.outlineColor = Cesium.Color.WHITE;
                }
            }

            // Zoom to layer
            viewer.flyTo(geojsonLayer);
        });

        // Visibility control
        document.getElementById("layerVisible").addEventListener("change", (e) => {
            if (geojsonLayer) geojsonLayer.show = e.target.checked;
            viewer.scene.requestRender();
        });

        // Opacity control
        document.getElementById("opacityRange").addEventListener("input", (e) => {
            if (!geojsonLayer) return;
            const opacity = parseFloat(e.target.value);
            const entities = geojsonLayer.entities.values;
            for (const entity of entities) {
                if (entity.polygon) {
                    entity.polygon.material = Cesium.Color.BLUE.withAlpha(opacity);
                }
            }
            viewer.scene.requestRender();
        });
    </script>
</body>
</html>
How It Works
- Load GeoJSON File – The
Cesium.GeoJsonDataSource.load()function reads your GeoJSON and converts it into Cesium entities. - Style Entities – Each polygon entity’s
materialproperty controls its fill color and transparency. - Visibility Toggle – The checkbox toggles the layer’s
.showproperty. - Opacity Slider – The slider dynamically adjusts the material’s alpha channel, allowing smooth transparency control.
Use Cases
- Display administrative boundaries or regions on a 3D globe
- Overlay roads, rivers, or urban infrastructure data
- Create GIS dashboards where multiple datasets need to be toggled dynamically
- Use in defense or aerospace simulations for area-based visualization
Conclusion
By converting shapefiles to GeoJSON and using CesiumJS’s built-in GeoJsonDataSource, you can easily integrate and visualize geospatial datasets interactively. The addition of visibility and opacity controls makes your application user-friendly and powerful for real-world GIS visualization.
If you’re building custom GIS or simulation tools, this method provides a scalable and efficient foundation for your web-based 3D map applications.
If you’re interested in a full-fledged GIS solution, check out our flagship product PrithviGIS – a powerful QGIS-based platform for real-time geospatial visualization. PrithviGIS is an indigenous GIS development in India.
Check out our Live Aircraft Simulation using CesiumJS.