At Manya Technologies, we specialize in building custom GIS solutions that integrate real-time data feeds with rich 3D visualization. One of our powerful implementations includes real-time radar/track display in a CesiumJS 3D globe — ideal for aviation, defense, simulation, and surveillance use cases.
✈️ Problem Statement
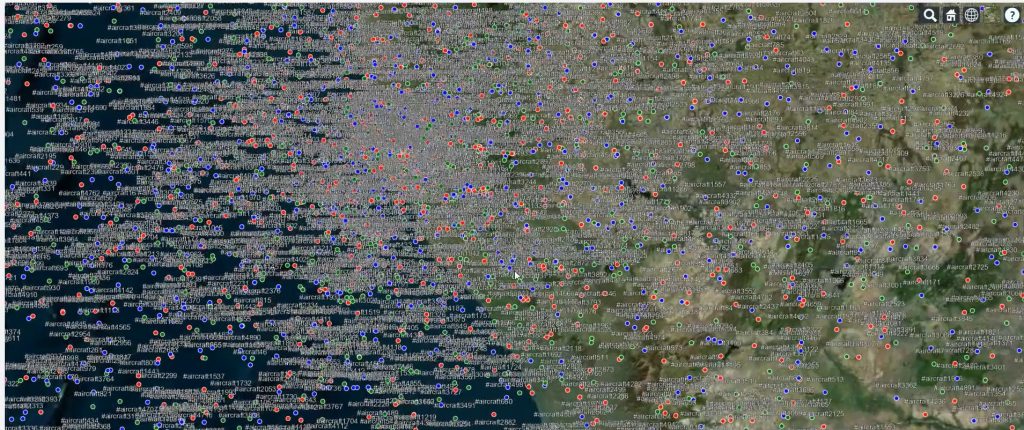
Modern applications demand live visualization of moving assets (like aircraft, UAVs, or ground vehicles) on a 3D globe — along with:
- Accurate positional and orientation updates
- Animated trail history
- Dynamic model changes based on classification
- Smooth, low-latency updates
- Data-rich tooltips or side panels
💡 Our Solution: CesiumJS + Live Data
Using CesiumJS, we built a robust track rendering module. It fetches or receives track updates (e.g., via WebSocket), and updates the globe in real time. Each track is:
- Positioned using
fromDegrees(lon, lat, alt) - Oriented with heading via
headingPitchRollQuaternion - Animated with
SampledPositionPropertyfor trails - Colored by classification
- Labeled with ID and metadata
- Optionally replaced by 3D models (e.g., fighter, helicopter, transport)
🔧 Code Highlights
Here’s a quick snapshot of how we add or update a target:
const position = Cesium.Cartesian3.fromDegrees(track.lon, track.lat, track.alt);
const heading = Cesium.Math.toRadians(track.heading || 0);

const orientation = Cesium.Transforms.headingPitchRollQuaternion(
    position,
    new Cesium.HeadingPitchRoll(heading, 0, 0)
);

viewer.entities.add({
    id: track.id,
    position,
    orientation,
    point: {
        pixelSize: 6,
        color: Cesium.Color.RED,
        outlineColor: Cesium.Color.WHITE,
        outlineWidth: 1
    },
    label: {
        text: `#${track.id}`,
        font: "10pt sans-serif",
        fillColor: Cesium.Color.WHITE,
        style: Cesium.LabelStyle.FILL_AND_OUTLINE
    }
});
We also use trail data (track.trail[]) with timestamps to animate the history of each entity using SampledPositionProperty.
🔄 Dynamic Updates
If the classification or location changes, the entity is updated instead of re-created. This ensures performance even with hundreds or thousands of tracks. Clustering is enabled for lower zoom levels.
📈 Use Cases
- Radar track display in ATC or defense systems
- UAV simulation and monitoring
- Air traffic monitoring dashboards
- Synthetic training environments
- PostGIS-synced track playback
🚀 Built on a Modern Stack
Our 3D visualization module is part of a complete stack including:
- CesiumJS (WebGL globe rendering)
- Qt/C++ simulation backend
- PostgreSQL/PostGIS for persistent storage
- WebSocket-based real-time data delivery
- Optionally integrated with QGIS for 2D fallback
🔍 Want to See It in Action?
Explore our Live Cesium Aircraft Simulation to see real-time aircraft movement visualized in 3D.
Whether you’re building a mission planning system or a real-time surveillance dashboard — we can help bring your data to life with custom integrations and simulation tools.