Point clouds have become a foundational data format for modern GIS applications, especially in drone mapping, LiDAR surveys, smart cities, infrastructure planning, mining, and defense. While specialized tools exist for point cloud processing, QGIS now offers powerful native capabilities to visualize and analyze point clouds in 3D—all within an open-source GIS platform.
In this blog, we explain how to visualize point clouds in 3D using QGIS, real-world use cases, and how QGIS compares with other popular point cloud tools.
What Is a Point Cloud?
A point cloud is a collection of 3D points, each defined by:
- X (longitude / easting)
- Y (latitude / northing)
- Z (elevation)
- Optional attributes (intensity, classification, RGB, timestamp)
Point clouds are commonly generated from:
- Drone photogrammetry
- LiDAR sensors (airborne, mobile, terrestrial)
- Laser scanners
- Radar and simulation systems
Typical formats:
- LAS / LAZ (most common)
- PLY
- XYZ
Why Use QGIS for Point Cloud Visualization?
QGIS has evolved significantly in recent versions and now supports native point cloud rendering and 3D visualization.
Key advantages:
✅ Open-source and cost-effective
✅ Native LAS / LAZ support
✅ 2D + 3D GIS integration
✅ CRS-aware visualization
✅ Works with raster, vector, and terrain together
✅ Extensible via plugins, Python, and C++
For organizations already using QGIS, this eliminates the need for multiple tools just to view and validate point cloud data.
How to Load a Point Cloud in QGIS
Step 1: Add the Point Cloud Layer
- Open QGIS
Layer → Add Layer → Add Point Cloud Layer- Select your .las or .laz file
QGIS automatically recognizes the point cloud structure and attributes.
Step 2: Style the Point Cloud
QGIS provides several rendering options:
- Elevation-based coloring
- Classification-based coloring (ground, building, vegetation, etc.)
- RGB coloring (if available)
- Intensity-based shading
This helps quickly distinguish terrain, structures, and objects.
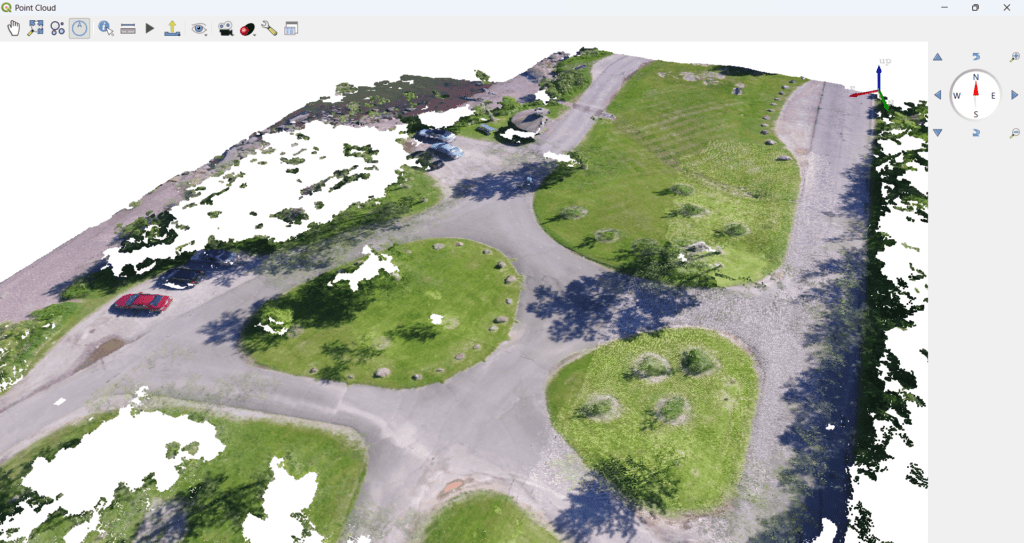
Visualizing Point Clouds in 3D View
Step 3: Open the 3D Map View
View → New 3D Map View- Configure terrain and vertical exaggeration
- Enable your point cloud layer
Now you can:
- Rotate, tilt, and zoom in true 3D
- Combine point clouds with:
- Orthophotos
- DSM / DTM
- Vector layers (roads, buildings, boundaries)
This is extremely useful for spatial understanding and validation.
Common Use Cases of 3D Point Cloud Visualization in QGIS
🛰️ Drone Mapping & Surveying
- Validate drone survey outputs
- Inspect building heights
- Check terrain accuracy
- Combine orthophoto + point cloud
🏗️ Infrastructure & Construction
- Road and bridge inspection
- Cut & fill verification
- Asset positioning
- Progress monitoring
🌱 Forestry & Agriculture
- Vegetation height analysis
- Canopy structure visualization
- Crop monitoring
🏙️ Smart Cities & Urban Planning
- 3D city visualization
- Building footprint validation
- Utility planning
🛡️ Defense & Security
- Terrain analysis
- Line-of-sight studies
- Simulation and mission planning support
Basic Analysis You Can Perform in QGIS
While QGIS is primarily a visualization platform for point clouds, it supports basic analysis, including:
- Filtering by elevation or classification
- Profile views
- Sampling elevations
- Integration with raster DEMs
- Overlay with vector data
For heavy point cloud processing, QGIS works best in combination with other tools.
Other Tools for Point Cloud Processing (Comparison)
🔹 CloudCompare (Open Source)
Best for:
- Detailed point cloud editing
- Registration and alignment
- Noise removal
- Precise measurements
Often used alongside QGIS.
🔹 PDAL (Open Source)
Best for:
- Large-scale point cloud processing
- Filtering, classification, conversion
- Automation and pipelines
Typically used in backend or server workflows.
🔹 OpenDroneMap
Best for:
- Generating point clouds from drone images
- Producing DSM, DTM, and orthophotos
QGIS is commonly used to visualize ODM outputs.
🔹 Commercial Tools
- Pix4D
- Agisoft Metashape
- Trimble / Leica software
Excellent processing capabilities, but expensive and license-bound.
QGIS + Other Tools: A Practical Stack
A very common and effective setup is:
- OpenDroneMap → generate point cloud
- PDAL → clean and classify
- QGIS → visualize, analyze, and publish
- PostGIS / Web GIS / Cesium → enterprise delivery
This open-source stack is increasingly used by government and enterprise organizations in India and globally.
Publishing Point Clouds Beyond Desktop QGIS
QGIS also fits well into web and 3D visualization pipelines:
- Serve processed layers via QGIS Server
- Convert point clouds to 3D tiles
- Visualize in CesiumJS
- Integrate with custom GIS applications (Qt, Web)
This allows scalable, browser-based access to 3D spatial data.
Why QGIS Is Ideal for Point Cloud Visualization
QGIS may not replace dedicated point cloud processing software, but it excels as a central GIS platform where point clouds, rasters, vectors, and databases come together.
For organizations looking to:
- Reduce software costs
- Build custom GIS solutions
- Integrate drone and LiDAR data
- Publish 3D geospatial information
QGIS is a strong and future-ready choice.
How Manya Technologies Can Help
At Manya Technologies, we build:
- Custom QGIS-based GIS applications
- Custom Drone mapping software solutions
- Drone & LiDAR visualization systems
- Point cloud workflows using QGIS, PDAL, and ODM
- Web and 3D GIS platforms using Cesium
- Enterprise GIS solutions with PostGIS
If you’re planning custom point cloud or drone mapping solutions, we can help design and implement a scalable system tailored to your needs.
📩 Contact us at: manyatechnologies.com
Manya Technologies – Custom GIS & Geospatial Software Solutions