Point clouds have become a core data format in today’s geospatial, surveying, mapping, and 3D reconstruction workflows. Whether the data comes from drones, LiDAR sensors, photogrammetry, or laser scanners, point cloud visualization is essential for inspection, analysis, measurements, and 3D understanding.
In this article, we break down what point clouds are, why visualization matters, and how you can view point clouds using popular tools like Potree, CloudCompare, MeshLab, and CesiumJS.
✅ What Is a Point Cloud?
A point cloud is a collection of millions (or billions) of 3D points, each with X, Y, Z coordinates and sometimes color (RGB), intensity, classification, or other attributes.
Point clouds are generated from:
- Drone photogrammetry
- LiDAR (airborne, terrestrial, mobile)
- 3D scanners
- Depth sensors
- SLAM devices
Each point represents a tiny portion of the real-world surface. When visualized together, they form a highly detailed 3D representation of terrain, buildings, objects, and structures.
🎯 Why Point Cloud Visualization Is Important
Visualizing point clouds helps in:
1. Accurate Inspection
- Cracks, corrosion, deformation
- Structural analysis
- Construction monitoring
2. Surveying & Mapping
- Topographic surveys
- Contour extraction
- Planimetric mapping
3. Infrastructure & Urban Planning
- Roads, bridges, powerlines
- City models
- BIM integration
4. GIS & Digital Twins
- Real-time 3D visualization
- Change detection
- Smart city applications
5. Drone Mapping & Photogrammetry
- Quality check
- Comparing outputs
- Mesh & DEM validation
🔧 How to View Point Clouds (Online & Offline)
Below are the most widely used tools for visualizing and analyzing point clouds.
1️⃣ Potree — Web-Based Point Cloud Viewer
Potree is an open-source, browser-based point cloud renderer designed for extremely large datasets (billions of points).
Why Potree?
- Runs in browser (no installation)
- Handles huge point clouds
- Web sharing/reporting
- Easy to embed into websites
- Supports measurements, clipping, filters
Supported formats
- LAS / LAZ
- PotreeConverter output
- EPT (Entwine Point Tiles)
How to view a point cloud in Potree
- Install PotreeConverter (Windows, Linux, macOS)
- Convert your
.las/.lazfile:PotreeConverter.exe input.laz -o output_folder - Open
output_folder/viewer.htmlin a browser - Customize with custom UI, annotations, textures, etc.
Potree is perfect for web-based visualization, drone mapping dashboards, online GIS, or customer sharing.
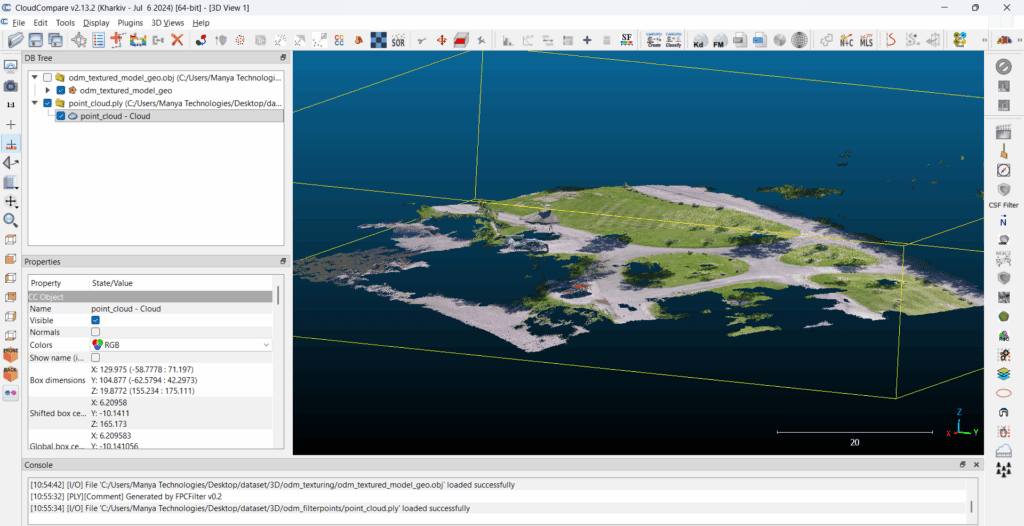
2️⃣ CloudCompare — Desktop Point Cloud Analysis
CloudCompare is one of the most powerful free tools for viewing, editing, and analyzing point clouds.
Why CloudCompare?
- Supports LAS, LAZ, PLY, E57, BIN
- Extremely fast visualization
- Advanced tools:
- Distance measurement
- Cross-sections
- Alignment (ICP)
- Noise filtering
- Segmentation
- Color / classification filters
- Handles large datasets easily
How to view in CloudCompare
- Install CloudCompare (Windows, Linux, macOS)
- Drag & drop
.las,.laz,.ply,.e57 - Adjust point size, intensity, elevation shaders
- Use tools for measurement, slicing, visualization
CloudCompare is the best offline tool for detailed engineering-level analysis.
3️⃣ MeshLab — Visualization + Mesh Editing
MeshLab is ideal when your workflow requires converting point clouds into meshes.
Capabilities
- Point cloud cleaning
- Meshing (Poisson, Ball Pivoting)
- Texture generation
- Smoothing, filtering
- Measurement tools
Better for model processing and small/medium datasets.
4️⃣ CesiumJS — Web 3D GIS Viewer
CesiumJS allows you to show point clouds in a full 3D globe environment.
Key benefits
- Stream point clouds as 3D Tiles (Point Cloud Tiles)
- Real-time camera, navigation
- API for measurement tools
- Combine with terrain, imagery, and vector layers
- Supports high-performance rendering
Great for GIS applications, drone dashboards, digital twins, defense, and simulation.
You can convert point clouds to 3D Tiles using:
- Cesium ion
- Entwine + PDAL pipeline
- Custom tilers
5️⃣ QGIS — GIS-Based Point Cloud View
QGIS 3.30+ now supports direct point cloud viewing via PDAL.
Features
- LAS/LAZ visualization
- Color by elevation/intensity
- Slicing & filtering
- Hillshading & rasterization
Useful for GIS workflows where point clouds need integration with geospatial layers.
🚀 Which Tool Should You Use?
| Purpose | Recommended Tool |
|---|---|
| Web viewer for clients | Potree / CesiumJS |
| Engineering analysis | CloudCompare |
| Mesh creation | MeshLab |
| GIS integration | QGIS |
| Very large datasets | Potree / Entwine |
🏁 Conclusion
Point cloud visualization is essential for drone mapping, LiDAR analysis, surveying, GIS, and 3D inspection workflows. Whether you need a fast desktop tool (CloudCompare), a web viewer (Potree, CesiumJS), or a GIS platform (QGIS), there are robust open-source tools that can handle billions of points.
If you need help integrating point cloud visualization in web apps, GIS, or custom dashboards, Manya Technologies can build:
- Custom 3D viewers (Potree / CesiumJS)
- Drone mapping dashboards
- Point cloud analytics
- WebODM-like platforms
- Enterprise GIS tools
Contact Manya Technologies for web based drone mapping solutions.