Introduction
In real-time 3D visualization systems such as air traffic, maritime tracking, or defense simulations, it’s essential to view detailed information about each moving target.
CesiumJS, a powerful open-source 3D globe engine, makes this possible through its viewer.selectedEntityChanged event — allowing you to show track details when a user clicks on an entity.
In this post, we’ll see how to display track details on click using a clean and efficient CesiumJS code example.
Use Case
This approach is widely used in:
- Radar or Air Traffic Displays
- Defense Situation Awareness Systems
- Fleet or Asset Tracking Applications
- 3D Simulation and Visualization Dashboards
By combining entity metadata with Cesium’s built-in InfoBox, users can instantly see the attributes of any selected track — like speed, altitude, IFF codes, and more — simply by clicking on it.
Working Code Example
Below is a complete, working example showing how to:
- Create a 3D track entity
- Assign descriptive details
- Enable click-based detail viewing
<!DOCTYPE html>
<html lang="en">
<head>
  <meta charset="UTF-8" />
  <title>CesiumJS Track Click Details</title>
  <script src="https://cesium.com/downloads/cesiumjs/releases/1.120/Build/Cesium/Cesium.js"></script>
  <link href="https://cesium.com/downloads/cesiumjs/releases/1.120/Build/Cesium/Widgets/widgets.css" rel="stylesheet">
  <style>
    html, body, #cesiumContainer { width: 100%; height: 100%; margin: 0; padding: 0; }
  </style>
</head>
<body>
<div id="cesiumContainer"></div>
<script>
  // ✅ Initialize Cesium Viewer
  const viewer = new Cesium.Viewer('cesiumContainer', {
    terrainProvider: Cesium.createWorldTerrain(),
    infoBox: true,
    selectionIndicator: true,
  });

  // ✅ Helper function to compute orientation
  function getTrackOrientation(heading, pitch, roll, position) {
    const hpr = Cesium.HeadingPitchRoll.fromDegrees(heading, pitch, roll);
    return Cesium.Transforms.headingPitchRollQuaternion(position, hpr);
  }

  // ✅ Create a single track
  function createTrack(track_data) {
    const position = Cesium.Cartesian3.fromDegrees(track_data.lon, track_data.lat, track_data.alt || 1000);
    const heading = Cesium.Math.toRadians(track_data.heading || 0);
    const orientation = getTrackOrientation(track_data.heading - 90, 0, 0, position);

    const modelColor = (track_data.iffMode1 === 0) ? Cesium.Color.RED : Cesium.Color.BLUE;

    viewer.entities.add({
      id: track_data.id,
      name: "Track-" + track_data.id,
      position: position,
      orientation: orientation,
      description: `
        <strong>ID:</strong> ${track_data.id}<br>
        <strong>Lat:</strong> ${(track_data.lat).toFixed(3)}
        <strong> Lon:</strong> ${(track_data.lon).toFixed(3)}<br>
        <strong>Alt:</strong> ${(track_data.alt).toFixed(0)} m<br>
        <strong>Speed:</strong> ${(track_data.speed).toFixed(1)} km/h<br>
        <strong>Heading:</strong> ${track_data.heading.toFixed(1)}°<br>
        <strong>RCS:</strong> ${(track_data.rcs).toFixed(1)}<br>
        <strong>IFF Mode1:</strong> ${(track_data.iffMode1)}
        <strong> Mode2:</strong> ${(track_data.iffMode2)}
        <strong> Mode3:</strong> ${(track_data.iffMode3)}<br>
      `,
      billboard: {
        image: "./images/fighter.png",
        width: 32,
        height: 32,
        rotation: -heading,
        verticalOrigin: Cesium.VerticalOrigin.CENTER,
      },
      label: {
        text: "Track-" + track_data.id,
        font: 'bold 14px sans-serif',
        fillColor: Cesium.Color.YELLOW,
        style: Cesium.LabelStyle.FILL_AND_OUTLINE,
        outlineColor: Cesium.Color.BLACK,
        outlineWidth: 3,
        verticalOrigin: Cesium.VerticalOrigin.TOP,
        pixelOffset: new Cesium.Cartesian2(0, -40),
        showBackground: true,
        backgroundColor: new Cesium.Color(0, 0, 0, 0.5),
      }
    });
  }

  // ✅ Add example track
  createTrack({
    id: 1,
    lat: 12.9716,
    lon: 77.5946,
    alt: 1500,
    speed: 720,
    heading: 45,
    rcs: 12,
    iffMode1: 0,
    iffMode2: 11,
    iffMode3: 23
  });

  // ✅ Show description when clicked
  viewer.selectedEntityChanged.addEventListener(function(entity) {
    if (Cesium.defined(entity)) {
      console.log("Selected:", entity.id);
    }
  });

  viewer.zoomTo(viewer.entities);
</script>
</body>
</html>
Explanation
- The
createTrack()function adds a Cesium entity with:- Billboard: small aircraft icon
- Label: displays track name
- Description: HTML-formatted info shown when clicked
- The
viewer.selectedEntityChangedevent automatically triggers Cesium’s built-in InfoBox, displaying all the entity’s details.
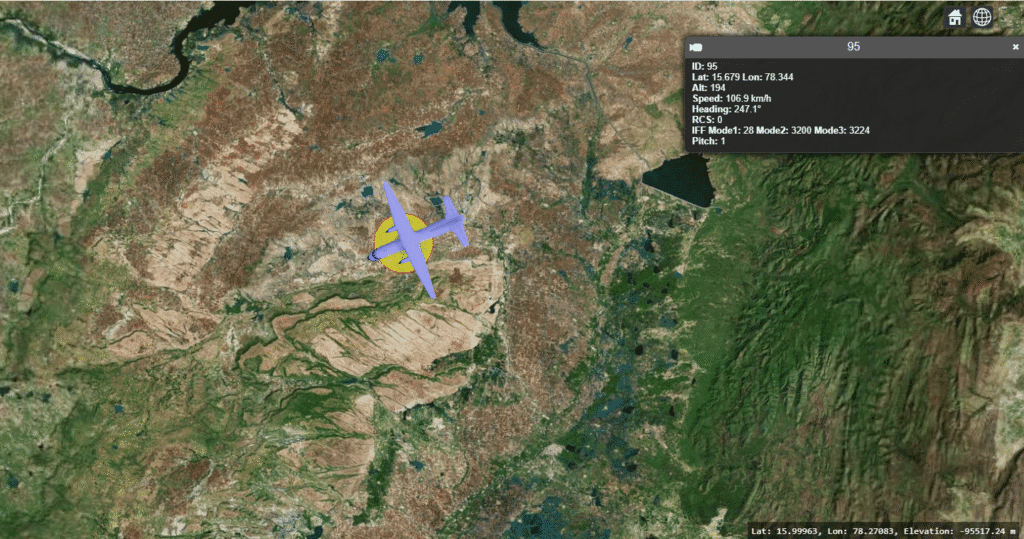
When you click on the track, the InfoBox on the right displays its metadata such as ID, coordinates, speed, and IFF codes — giving users real-time situational awareness.
Conclusion
Displaying track details on click in CesiumJS is a straightforward yet powerful feature for real-time visualization systems.
By embedding rich metadata in the entity’s description field, you can quickly build interactive, informative, and professional 3D tracking dashboards — whether for defense, aviation, or fleet management.
🔗 Related:
Displaying 3D Symbols and Models in CesiumJS
CesiumJS Heading Vector Visualization
If you’re interested in a full-fledged GIS solution, check out our flagship product PrithviGIS – a powerful QGIS-based platform for real-time geospatial visualization. PrithviGIS is an indigenous GIS development in India.
Check out our Live Aircraft Simulation using CesiumJS.