Introduction
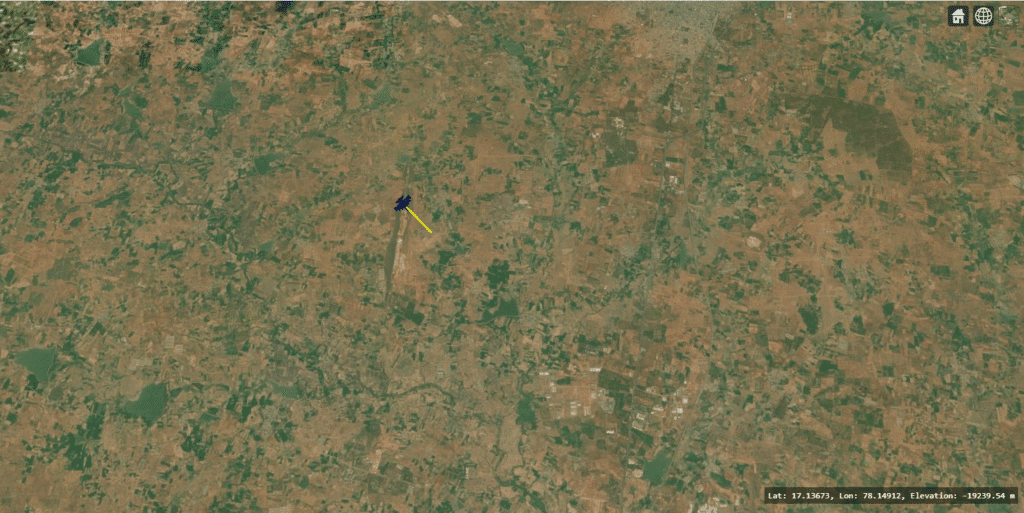
In real-time geospatial or simulation applications—such as radar tracking, flight monitoring, or vehicle movement visualization—it’s often helpful to show not only the object’s current position but also its heading direction and speed. This is typically done using a heading vector (also known as a velocity vector or direction line).
A heading vector provides an instant visual cue of where the object is heading and how fast it’s moving. In CesiumJS, this can be implemented using a dynamic polyline entity that updates as the object moves.
Use Case
Let’s consider a scenario where we’re tracking multiple aircraft in a 3D map. Each aircraft entity shows its live position, and a heading vector extends forward from it, scaled by its speed. This vector dynamically adjusts as the aircraft changes heading or velocity—making it ideal for air traffic control visualization, defense radar systems, or live simulations.
Implementation
The following function adds a heading vector to any moving entity in a CesiumJS viewer. The vector’s length is proportional to the object’s speed, and its direction corresponds to the heading.
function addHeadingVector(viewer, track_data, speedScale = 30) {
    // Remove any existing vector for this track
    viewer.entities.removeById(track_data.id + "_vector");

    // Add a new polyline showing the heading direction
    return viewer.entities.add({
        id: track_data.id + "_vector",
        polyline: {
            positions: new Cesium.CallbackProperty(() => {
                const speed = track_data.speed || 0;  // in km/h
                const headingRad = track_data.heading; // radians
                const vectorLength = (speed / 3.6) * speedScale; // convert to m/s → scaled length

                const lat1 = Cesium.Math.toRadians(track_data.lat);
                const lon1 = Cesium.Math.toRadians(track_data.lon);
                const R = 6371000; // Earth radius (m)

                const dNorth = Math.cos(headingRad) * vectorLength;
                const dEast  = Math.sin(headingRad) * vectorLength;

                const endLat = Cesium.Math.toDegrees(lat1 + dNorth / R);
                const endLon = Cesium.Math.toDegrees(lon1 + dEast / (R * Math.cos(lat1)));

                return [
                    Cesium.Cartesian3.fromDegrees(track_data.lon, track_data.lat, track_data.alt),
                    Cesium.Cartesian3.fromDegrees(endLon, endLat, track_data.alt)
                ];
            }, false),
            width: 2,
            material: Cesium.Color.YELLOW
        }
    });
}
Explanation
- speedScale controls how long the vector appears relative to real-world speed. You can adjust it to make vectors longer or shorter visually.
- The heading is assumed to be in radians (if you’re using degrees, convert using
Cesium.Math.toRadians). CallbackPropertyensures that the vector dynamically updates every frame whentrack_datachanges.- You can easily integrate this with your entity update loop or WebSocket data stream for live updates.
Conclusion
Heading vectors are a simple yet powerful visual feature for real-time movement visualization in CesiumJS. They enhance situational awareness and help users intuitively understand direction and velocity.
Whether you’re building a radar display, a flight simulator, or a vehicle tracking dashboard, this small addition can make your visualization far more informative and professional.
If you’re interested in a full-fledged GIS solution, check out our flagship product PrithviGIS – a powerful QGIS-based platform for real-time geospatial visualization. PrithviGIS is an indigenous GIS development in India.
Check out our Live Aircraft Simulation using CesiumJS.

